
DECISION TREES
OVERVIEW:
Decision Trees learn rules on how to splits data based on the input feature values. The general idea is that you wind up with an object that resembles a tree, where the internal nodes correspond to questions about an input feature; the branches lead to answers; and a final decision can be reached via other internal nodes or by terminating in a leaf as you can see on the figure on the right.
The output of a Decision Tree can be interpreted as a model that behaves dramatically like a human makes decisions. From the root of the tree, to a leaf, it follows a specific path that represents a sequence of decisions which ultimately lead to a prediction. The power of a Decision Tree comes when you want to have both predictions and insights into how those predictions were reached. as you see about a person if he is fit in a decision example below.

This is a particularly pragmatic approach for text classification if as the data is already transformed its data into numeric features (i.e. "pre-processed"). For this demonstration, we employ a CountVectorizer from scikit-learn to transform article content into frequency-based data in the form of vectors. The frequencies of the article content are analyzed by the Decision Tree to determine what words are the most likely to be useful in distinguishing between different opinions about regulation. Each split in the tree corresponds to a decision based on either the presence of a term or the frequency of that term. In this way, a Decision Tree elucidates how language patterns relate to stance categories.

The objective here is to categorize articles as anti-regulation, neutral, strongly pro-regulation, and weakly pro-regulation, which could detect how varying perspectives appear in word usage. The model helps in categorization through prediction, but the decision tree itself can also be used as a visual explanatory tool. There are two decision tree visualizations in this section: one contains a simplified version (for readability, it has limited depth), and the other is more complete but with less labeling, to highlight how deeper patterns of language can inform classification decisions.
Using this model is anticipated to achieve predictive validity and interpretability. More sophisticated models may use a variety of parameters for more predictive modeling; however, Decision Trees are particularly useful for showing how certain terms or combinations of terms are linked to certain classifications. This will help tackle our objectives of gaining a better understanding of framing effects, and further provide an analysis of bias or persuasion techniques, as well as contribute to the larger picture of how regulatory opinions are conveyed in the articles across the dataset.
DATA PREP:
Decision Trees, are dependent on a dataset of inputs with labeled outcomes. In this case, we want to classify articles based on the stance toward regulation with each article already labeled with one of the following four categories: anti-regulation, neutral, strongly pro-regulation, or weakly pro-regulation. Each of these labels can be treated as labeled ground truth for training and testing the model.
The raw text of articles was first converted into numeric features using CountVectorizer. This produced a document-term matrix with each row an article and each column counting how many times some word occurred in that article. This produced a sparse, high dimensional matrix of numbers which particularly suited Decision Tree models with many input features. Once CountVectorizer was applied, and no further transformations were made since the model can simply learn splits based upon term frequencies directly.
To assess the model and perform an appropriate model evaluation, the data was split into training and testing subsets in a way that accepted an 80/20 stratified split. That way each subset represented each class in a relative way. The model training data was used to create the tree by establishing rules based on features in order to most effectively differentiate opinion categories and the test data was set aside to establish how well the model would generalize to data that its has not yet seen. This separation in the subsets is vital to ensure overfitting does not occur and to avoid bias in capturing model performance.
Visuals below show a snapshot of the countvectorized dataset, the structure of the training and testing splits, and examples of the features that were created in the original dataset. These visuals should provide additional confidence that the model was given the correct input format and provides transparency into the preprocessing pipeline.
Before Transformation:

After Transformation:

Training Data (Features):

Training Data (Label):

Testing Data (Features):

Testing Data (Label):

CODE:
Link to the code of Decision Trees: https://github.com/saketh-saridena/TextMining_Project
RESULTS:
Decision Tree-1:
The first model employed entropy as the splitting criterion and had a maximum depth of 5. The tree was highly biased towards the anti-regulation class and realized a recall of 0.90 for that class as shown in the confusion matrix below.

However, it was not able to generalize across other classes, particularly it made no classifications of weakly pro-regulation. We depict the imbalance in classification report below, where the weighted F1-score was 0.42 and macro F1-score was 0.28 in the classification report.

From tree visualization below, we see that the splits were dominated by a handful of words. Therefore, the tree was perfect in predicting some branches but had little scope overall. Most terminal nodes aligned with the anti-regulation label, indicating an over-fit to the majority class.

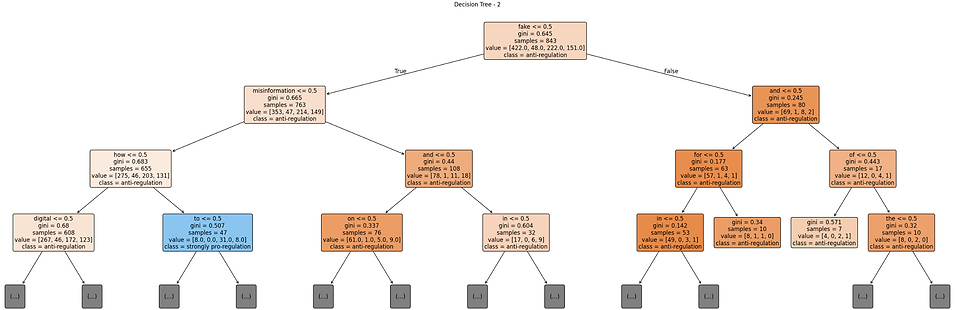
Decision Tree-2:
The second tree, which was configured using the Gini index and a greater depth (max depth 10), provided a slightly improved overall accuracy of 52%, as illustrated in the following confusion matrix.

The second tree made somewhat more balanced predictions compared to the first model, assigning numerous correct predictions to weakly pro-regulation and strongly pro-regulation articles even while not correctly classifying in the neutral class at all, as measured by the precision and recall scores in classification report.

The tree structure below reflected more complexity and branching as several mixed terms were employed to reach predictions. While the second tree represents a more complex output, where more terms were utilized, the model remained heavily weighted towards the anti-regulation class which reflects that although more terms used, the decision routes were not greatly diversified.
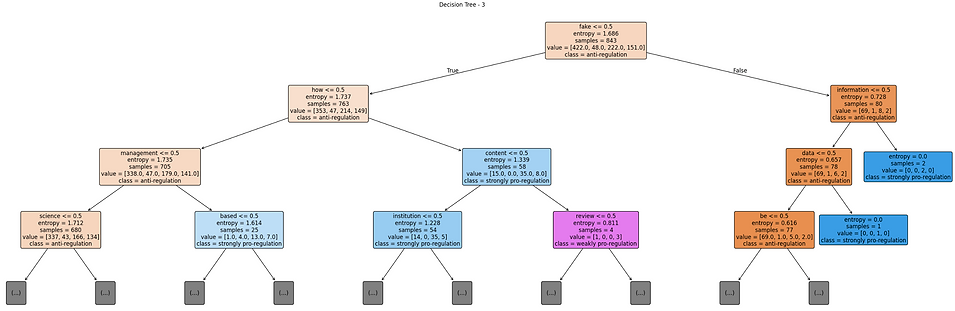
Decision Tree-3:
The third model used entropy but had the limitation of feature usage constrained to 50, which created a more balanced model overall. Each class appears to have a count of correct predictions, as reflected in confusion matrix below.

In addition, the recall for neutral, strongly pro-regulation, and weakly pro-regulation improved over and above the last models. The classification report below supported this assertion, with the most balanced macro average F1-score of 0.41, with a smaller, but acceptable overall accuracy of 48%.

The visualization of decision tree below reveals that feature usage is broader and that node splits are more even. This suggests the limit on feature space and improved broad classification performance across under-represented classes. In addition, it seems the limited feature space allows the model to find generalized rules as opposed to relying on a small number of key words that dominated the last model performance across under-represented classes.
CONCLUSION:
The Decision Tree models also provided a visual and intuitive approach for the batch processing of differentiating between opinions in text according to patterns across words. Each tree worked as a flowchart that asked a series of yes or no questions about certain key words that were used in the articles, and produced a final label for each. You could see visually what the important words were in identifying a stance and how those decisions were made by the models.
Of the three versions tested, the final model - which focussed on the most useful words only - seemed to provide the most balanced results. This model was superior to the others in recognizing not only strongly expressed opinions, but also those that were more neutral and moderate. This is especially important when trying to get a sense of the whole range of opinions in a dataset, not just the loudest or the most extreme.
In conclusion, the decision trees assisted in showing which types of language were associated with which opinions and how those patterns could be used to make predictions. Overall, while the models were imperfect, they did provide a way to look at how opinions about regulation are organized and expressed in written articles.
Github Repo (Code and Data): https://github.com/saketh-saridena/TextMining_Project